20 Best AI App Marketing Tools In 2026
Boost app growth with the 20 best AI marketing tools of 2026. Master ASO, automate retention, and scale faster with expert picks for indie devs and growth teams
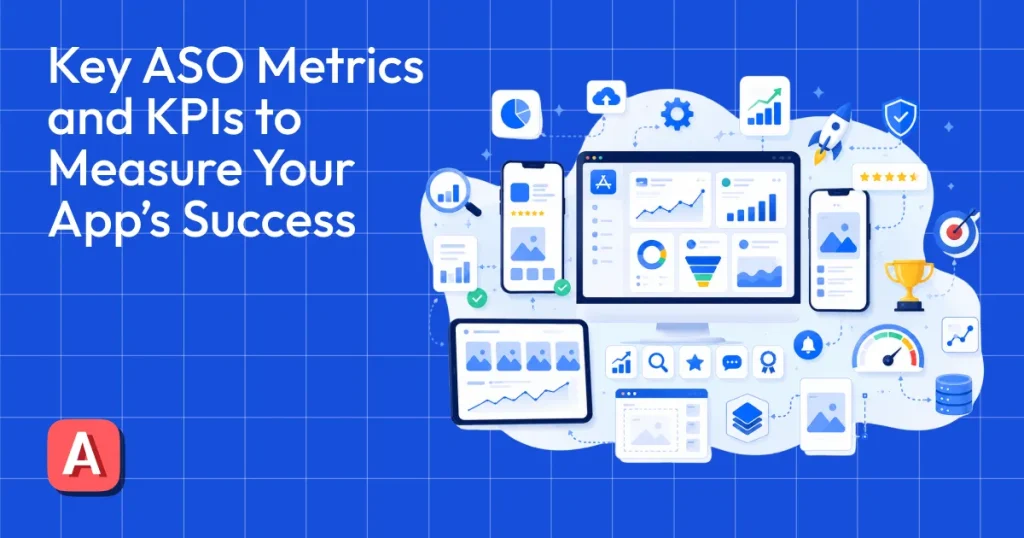
ASO metrics and KPIs are performance indicators that help you determine whether your App Store Optimization efforts are working. They show how effectively your ASO strategies are driving app visibility, increasing downloads, and bringing in more users.
Some of the key app performance metrics and KPIs include keyword rankings, conversion rates, and download velocity. However, not all metrics deserve the same attention. And tracking the wrong one only leads to wasted resources and bad decisions.
To help you understand what metrics matter most, the AppLaunchpad team has created this comprehensive guide to ASO metrics and KPIs. These KPIs help you measure how well your ASO strategy is working and whether you’re moving closer to your app’s growth goals. From key app performance metrics to how to measure them, we’ve covered everything you need to know.
ASO metrics and KPIs are measurable indicators that help you measure your app’s performance on the App Store and Google Play Store. They determine how effectively your app’s visibility is improving, converting store visitors into installs, and attracting organic users.
Like any product, your app goes through a sales funnel, from awareness to interest to conversion.
So tracking the right App Store Optimization metrics and KPIs helps you capture users at each stage of the funnel.
It’s an effective way to understand what’s working and where your ASO strategies need improvement. This helps you lower marketing costs, improve conversion rates, reduce user acquisition costs, and drive sustainable app growth.
While App Store Optimization metrics and KPIs are closely related, they serve different purposes.
Metrics are measurable data points that track your app’s performance and day-to-day ASO activities, including impressions, installs, uninstalls, and user sessions. These data points provide valuable context, but on their own, they don’t tell you whether your app is succeeding or your ASO strategies are working.
On the other hand, KPIs (Key Performance Indicators) measure progress toward specific goals. Examples include conversion rate, organic install growth, keyword rankings, user retention rate, and cost per acquisition (CPA). These KPIs help you understand whether your ASO efforts are delivering the results you want.
| Metric | KPI |
| Installs | Growth in organic installs |
| Positions | Share of keywords ranked in the top 10 |
| Impressions | Improved impressions with a stable conversion rate (CR) |
App Store Optimization metrics and KPIs work together to give you a complete picture of your app’s performance. KPIs show whether you’re achieving your app growth goals, while metrics explain what’s driving those results.
For example, if your App Store conversion rate (KPI) starts to decline, supporting app performance metrics such as product page views, screenshot engagement, ratings, or review sentiment can help you identify the cause. Together, they help you make informed ASO decisions and continuously improve your app’s performance.
As mentioned earlier, every app follows a user journey before it generates revenue, which is a major part of ASO metrics and KPIs. Users first discover your app, decide whether to install it, start using it, and eventually become loyal customers. This journey is known as the ASO growth funnel.
Instead of measuring only downloads, the funnel helps you understand where users enter, where they leave, and which parts of your App Store listing or product experience need improvement.
The six major stages are visibility, product page views, conversion, installs, engagement and retention, and revenue and advocacy.
Each stage directly affects the next. For example, poor visibility limits traffic, weak creatives reduce installs, and poor onboarding increases churn. Optimizing every stage leads to stronger long-term app growth and monetization.
While both the Apple App Store and Google Play Store calculate conversion rates differently.
Apple App Store starts tracking when users see your app anywhere in the App Store, such as in search results, category pages, or featured sections. Its conversion rate measures the percentage of users who download the app after that initial app view.
Google Play Store, on the other hand, starts tracking after users land on your store listing page. Its conversion rate measures how effectively your store listing assets, such as app screenshots, icon, feature graphic, and description, convince visitors to install the app.
| Apple App Store | Google Play Store |
| Funnel starts with an App view | Funnel starts with a Store Listing Visitor |
| Conversion measures App View → Download | Conversion measures Store Listing Visitor → Install |
| Reflects overall discoverability and conversion | Focuses primarily on store listing performance |
ASO metrics and KPIs can be grouped into three core pillars, i.e., visibility, conversion, and retention, which we’ve broken down below.
Before users even download your app, they need to find it first. Visibility metrics measure how easily users can discover your app on the App Store and Google Play Store. The more visible your app is, the greater the chance it has of appearing in search results.
The ASO KPIs to measure are as follows.
Keyword rankings measure where your app appears in App Store and Google Play search results for target keywords. The more keywords your app ranks for, the higher its visibility.
But one thing to consider is to target only those keywords that have enough search volume. You can also target branded and non-branded keywords, and avoid using the same keywords across multiple pages.
Tools to use: AppTweak, App Radar.
Search impressions show how often your app appears in search results. It also includes browse impressions, which measure visibility from category pages, Top Charts, and featured sections. Monitoring impression trends and traffic sources helps you understand how users discover your app and whether your visibility is improving.
Tools to use: App Store Connect, Google Play Console.
Category rankings indicate your app’s position within its category and its performance, e.g., productivity, gaming, or education. Tracking these rankings helps you measure your visibility against competitors and identify opportunities to improve your market position in the app stores.
Tools to use: AppTweak, Sensor Tower, App Radar.
After visibility, the second most important KPI to consider is conversion, because getting people to visit your app page is the first step, while persuading them to install your app is the next. Conversion metrics measure how effectively your app listing turns visitors into installers after they discover your app.
There are two factors influencing conversion.
On-page metadata: The on-page metadata includes your app title, description, icon, screenshots, featured image, and preview videos. Strong, high-quality visuals help communicate your app’s value and convince users to install it.
Off-page metadata: The off-page metadata covers signals such as download count, user ratings, and reviews. People are more likely to trust and download an app that others have already installed and rated positively.
There are four types of conversion metrics to track.
App Store Conversion Rate measures the percentage of users who install your app after viewing your app store listing. This is the main metric to check page efficiency and is calculated separately for different traffic sources, i. e search, recommendation, and direct visit.
Tools to use: App Store Connect, Google Play Console.
Product page views show how many users visit your app listing after discovering your app. This metric helps you understand how effective your app is at attracting potential users and moving them from discovery to your product page.
A high number of product page views generally indicates strong visibility, while low page views may suggest your app isn’t ranking well for relevant keywords.
Tools to use: App Store Connect, Google Play Console, Google Analytics.
Install rate measures the percentage of users who complete the app installation after viewing your app listing. It reflects how effectively your app listing converts interested visitors into new users and is one of the most important ASO conversion metrics. Tracking first-time installs and install completion rate helps you evaluate how effectively your listing converts interested visitors into new users.
Tools to use: Firebase Analytics, App Store Connect, Google Play Console.
Creative performance evaluates how your store assets influence conversion. This includes the effectiveness of your app screenshots, app icon, preview video, and feature graphic (Google Play). Also, you can run A/B tests to help identify which creative variations generate higher conversion rates.
Tools to use: AppLaunchpad, SplitMetrics Optimize.
Engagement and retention KPIs measure how users interact with your app after installation. While downloads indicate acquisition, these metrics reveal whether users find your app valuable enough to keep using, contributing to better rankings and long-term growth.
Key metrics that you should track are.
Retention rate measures the percentage of users who return to your app after installing it. It is one of the clearest indicators of user satisfaction and product-market fit. Tracking Day 1, Day 7, and Day 30 retention, along with cohort retention, helps you understand how well your app keeps users engaged over time and where users begin to drop off.
Tools to use: Firebase Analytics, Mixpanel, Amplitude.
Active user metrics show how many unique users interact with your app over a specific period. Common metrics include Daily Active Users (DAU), Weekly Active Users (WAU), Monthly Active Users (MAU), and the DAU/MAU stickiness ratio, which indicates how frequently users return to your app.
Tools to use: Firebase Analytics, Mixpanel, Amplitude.
Session metrics measure how users engage with your app during each visit. Important ASO metrics include sessions per user, average session duration, session frequency, and time between sessions. These insights help you understand user behavior, identify highly engaging features, and uncover friction points in the user journey.
Tools to use: Firebase Analytics, Amplitude, Mixpanel.
Churn and uninstall rate show how many users stop using or remove your app over time. Monitoring churn rate, uninstall rate, and user drop-off trends helps identify where users lose interest and which channels bring the highest-quality users. Reducing churn is often more cost-effective than acquiring new users.
Tools to use: Firebase Analytics, AppsFlyer, Adjust.
While visibility, conversion, and retention are the foundation of ASO, several other ASO metrics and KPIs play an equally important role in measuring your app’s overall growth.
User acquisition metrics measure how effectively your app attracts new users and where those users come from. They help you evaluate the performance of your ASO efforts, paid campaigns, and marketing channels while identifying which sources bring long-term users.
The KPIs that fall under this are.
Organic downloads represent installs generated without paid advertising. Users typically discover your app through App Store or Google Play search, featured placements, browse traffic, or external organic sources such as search engines and referrals. Growing organic downloads is one of the primary goals of ASO because it helps you get more users without increasing your marketing costs.
Tools to use: App Store Connect, Google Play Console, AppTweak, App Radar
Paid and organic acquisition measure two different ways users discover your app. Organic installs come from unpaid sources such as App Store or Google Play search, browse traffic, and featured sections, while paid installs come from ads.
Tracking the balance between the two, along with Cost Per Install (CPI), Cost Per Acquisition (CPA), and attribution sources, helps you understand which channels bring the most valuable users and whether your marketing budget is delivering a good return.
Tools to use: AppsFlyer, Adjust, Branch, Google Analytics 4, App Store Connect, Google Play Console.
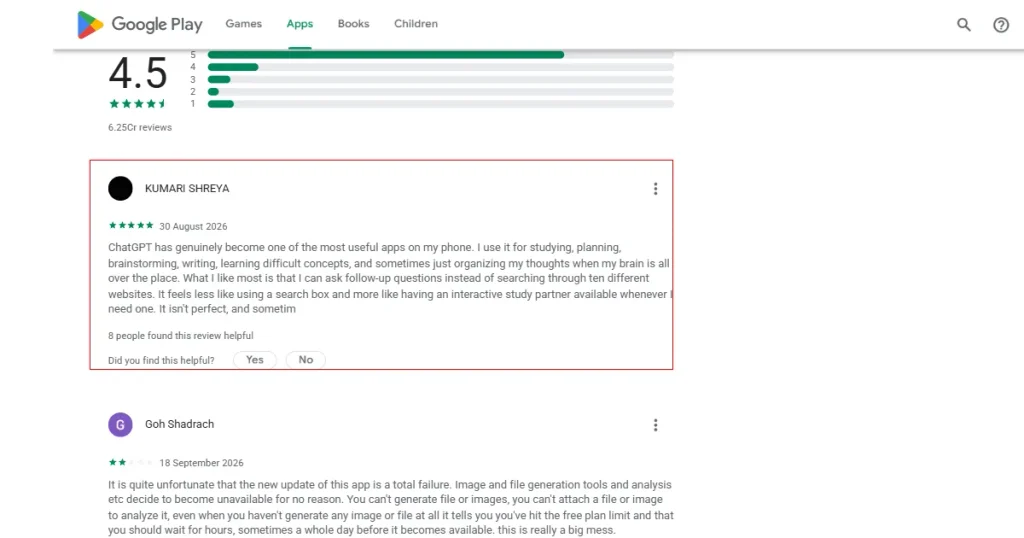
User feedback metrics are an important part of ASO metrics and KPIs, as they help you understand how users rate, review, and see your app after using it. They help you understand user satisfaction, identify areas for improvement, and build trust with potential users.
The KPIs that fall under this are.
App ratings show how happy users are with your app. Track your average rating to see overall user satisfaction, rating distribution to understand how many users give 1, 2, 3, 4, or 5 stars, and rating velocity to see how quickly new ratings are coming in. These ASO metrics and KPIs help you spot problems early and understand how updates affect user satisfaction.
Tools to use: App Store Connect, Google Play Console, AppTweak
App reviews explain what users like and dislike about your app. Start by looking at your reviews to understand overall satisfaction, both positive and negative.
Pay attention to recurring problems, especially after app updates or new feature releases. Also, track how many new reviews your app receives over time and whether user feedback is becoming more positive or negative. This helps you identify areas for improvement and understand how users feel about your app.
Tools to use: App Store Connect, Google Play Console, App Radar
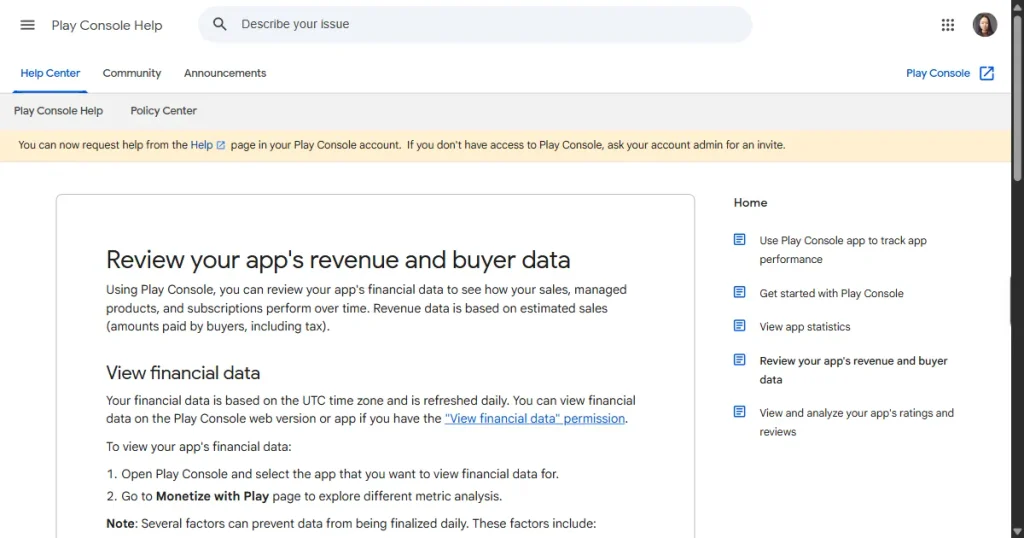
Revenue metrics show how well your app turns users into revenue. They help you measure the value of each user, understand how effectively your app is generating income, and evaluate whether your marketing efforts are delivering a good return.
Focus on these key ASO metrics and KPIs.
User value metrics show how much revenue each user brings to your app over time.
Three metrics are especially important. Average Revenue Per User (ARPU) measures the average revenue from all users, Average Revenue Per Paying User (ARPPU) focuses only on users who make purchases, and Lifetime Value (LTV) estimates the total revenue a user is expected to generate throughout their time using your app.
Tools to use: Firebase Analytics, Google Analytics 4, AppsFlyer, Adjust, RevenueCat.
Marketing efficiency measures how effectively your marketing spend turns into revenue. It helps you understand whether your acquisition campaigns and monetisation strategy are delivering a good return.
To measure this, monitor Return on Ad Spend (ROAS) to see how much revenue your ad campaigns generate, subscription conversion rate, and in-app purchase revenue to track earnings from one-time purchases.
Tools to use: AppsFlyer, Adjust, Firebase Analytics, Google Analytics 4.
Tracking individual ASO metrics and KPIs is useful, but the real value comes from building a structured ASO measurement system. A clear framework helps you monitor performance consistently, identify optimization opportunities, and make decisions based on data instead of assumptions.
1. Define Your Growth Goals
Before choosing KPIs, decide what success looks like for your app. Your goals could be increasing visibility, improving conversion rates, retaining more users, or growing revenue. The metrics you track should directly support these objectives.
2. Align KPIs with Your App’s Lifecycle
Not all ASO metrics and KPIs matter equally throughout your app’s lifecycle. The metrics you focus on should reflect your app’s current stage of growth.
3. Choose the Right Tools
Use a combination of ASO platforms and analytics tools to track your ASO metrics and KPIs. ASO tools help monitor visibility and optimize store listings, while analytics platforms measure user behavior, retention, and revenue after installation.
4. Benchmark and Monitor Performance
Establish baseline ASO metrics and KPIs before making changes to your store listing. Monitor KPIs regularly and compare results against previous periods or competitors to evaluate whether your ASO strategies are delivering measurable improvements.
ASO tools generally fall into two categories:
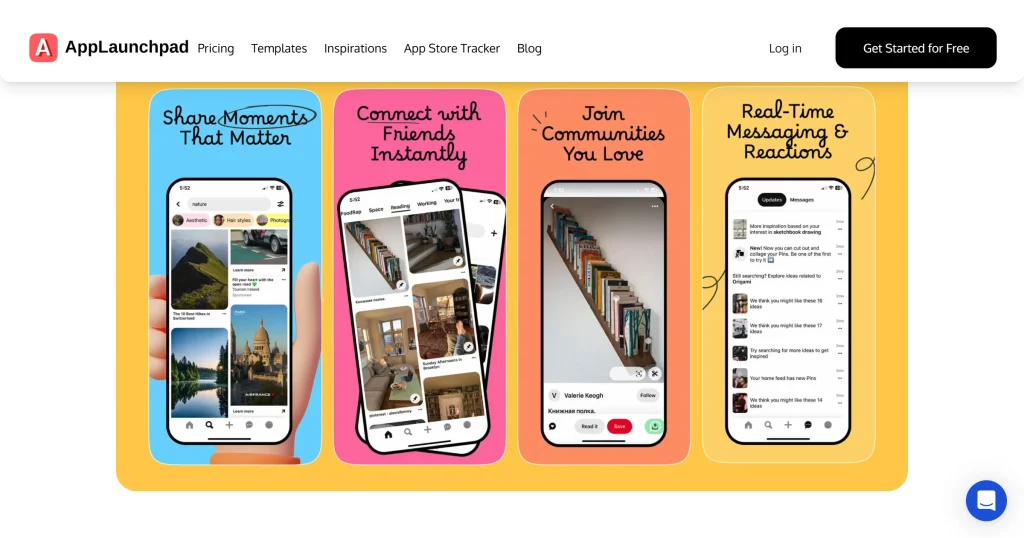
AppLaunchpad is an App Store screenshot generator designed to help developers create high-converting app screenshots for the App Store and Google Play. Since screenshots are often one of the first visual elements users evaluate, well-designed app screenshots can significantly improve conversion rates.
Key features include:
SplitMetrics Optimize helps developers test their app store visuals before publishing. Teams can test different screenshots, app icons, preview videos, and text to see which versions perform better. By comparing results through A/B testing, they can make data-backed decisions, avoid using visuals that perform poorly, and improve conversion rates.

AppTweak is an ASO platform that helps developers improve app discoverability on the App Store and Google Play. It offers keyword research, search ranking tracking, competitor analysis, and market insights, helping teams optimize their store listings and make better ASO decisions.
Vanity metrics are numbers that look impressive but have little to no impact on your app’s long-term growth. They can show activity, but they don’t always tell you whether your ASO strategies are working.
Some common vanity ASO metrics and KPIs include:
Instead of optimizing for individual metrics, focus on how they contribute to the entire ASO growth funnel, from visibility to retention and revenue.
Specific ASO Metrics and KPIs that guarantee success. The most important ASO metrics and KPIs depend on your app’s growth stage and business goals. For new apps, prioritize visibility metrics to improve discoverability. If your app already attracts traffic, focus on conversion metrics to maximize installs.
The key is to track metrics across the entire ASO funnel rather than relying on a single metric. A balanced measurement system helps you identify bottlenecks, make informed optimization decisions, and build sustainable app growth.
App Store Optimization (ASO) metrics are numbers that help you understand how well your app is performing on the App Store and Google Play. They track important areas such as how easily people find your app, how many download it, how users interact with it, how many keep using it, and how much revenue it earns.
The timeline varies depending on the type of optimization and competition in your category. Metadata updates may show results within a few weeks, while improvements in rankings and organic downloads often take one to three months.
Core metrics such as keyword rankings, impressions, and conversion rates should be reviewed weekly. Retention and revenue metrics are typically analyzed monthly to identify long-term trends.
App Store Optimization metrics focus on improving your app’s visibility and conversion on the App Store and Google Play. App performance metrics cover a broader range, including user engagement, retention, and revenue after installation. Together, they help you measure your app’s overall success.
For keyword research and ASO tracking, tools like AppTweak and App Radar are beginner-friendly choices. If your goal is to improve store listing creatives, use the AppLaunchpad ASO tool.